
IT systems are self-operational, and cloud-based systems do not require any installation. As an IT manager, you may assume that you can simply set up the systems, provide user access, and then focus on other tasks. However, if that were true, big companies would not invest in running dedicated IT operations departments.
In the event that your applications cease to function, your entire business will come to a standstill. If these applications are integral to your business’s sales delivery process, like with Web applications, then any time the application is not operational results in a loss of revenue.
The purposes of application monitoring
The most complex task in IT operations is to determine the reason behind an application’s malfunction. Since applications depend on the efficient functioning of supporting services and hardware, the issue may not necessarily lie within the applications themselves. Therefore, if your applications cease to operate properly, it becomes necessary to examine your entire IT system in order to identify the root cause.
There are two main benefits to applications monitoring:
- In order to prevent any performance issues.
- To identify system dependencies
Systems do not experience sudden malfunctions without any cause, and problems typically develop gradually rather than appearing out of nowhere. Occasionally, a sudden decrease in performance of an application can be attributed to a service issue that has been accumulating over time. A lack of storage space on a server serves as one example.
Hence, it is crucial to acquire a monitoring system capable of providing a trail that facilitates investigations in case of any issues – this process is known as root cause analysis. Additionally, one must be vigilant for a gradual decline in performance that can eventually become noticeable – this monitoring responsibility is carried out through continuous automated application surveillance.
Application monitoring obligations
Applications serve others, including within the business, other businesses, or the general public. Therefore, if an application fails to perform efficiently, it results in disappointing people. This can be discouraging, but if your application delivery is governed by a service level agreement (SLA), such performance issues can lead to significant financial losses.
The negative impact of poor application performance can have long-lasting consequences on the reputation of a business, while also resulting in immediate financial losses or missed opportunities. The company expects the applications you manage to be consistently accessible during business hours and potentially even 24/7.
Application monitoring delivery models
Centralizing application monitoring is crucial to avoid technicians having to log into each individual server to track the activities of hosted applications. If your application is designed for external use, an application monitoring system that accesses services via the internet provides a more accurate representation of your system’s working conditions compared to an internal monitoring package.
There are two choices available for application monitors – on-premises and cloud-based hosting options. The functioning of on-site and cloud-based application monitoring tools is quite similar as both rely on data transmitted across a network. Transferring across the internet is just as simple as transfers over the network for self-hosted centralized monitoring services.
Regardless of whether the application monitoring system is a SaaS package or a self-hosted system, it must have the capability to monitor hybrid environments. This implies that on-site systems must also be able to monitor remote and cloud-based modules. SaaS packages should be capable of inspecting the delivery systems that function on your local network, as well as other cloud-based services.
Application dependency mapping
Merely enumerating the applications that you are aware of and utilizing in the interface of a monitoring tool will not provide you with adequate monitoring services for today’s IT environment. The inclusion of an autodiscovery feature is now crucial as it allows an application monitoring tool to configure itself and uncover the applications and services being used, even if they were previously unknown.
Applications are constructed in tiers and connect to other applications, which in turn depend on server resources. To illustrate, let’s consider a website. If the site features advertising that is delivered via a content delivery network (CDN), there is already a service affecting the loading times of your web pages that you may not have taken into account. If the website is built using WordPress and incorporates plug-in services like a shopping cart, additional components must be monitored. The website might also rely on a database and be reliant on a web server application.
It is essential to trace and map all the modules that contribute to the development of a user-facing application. Moreover, it is important to take into account the servers that host these contributing modules, as well as the specific resources and services provided by those servers to support the underlying applications that users interact with.
The underlying cause of performance issues in your applications could potentially be attributed to inadequate server performance or connectivity problems between servers. Therefore, it is imperative to identify the specific location of these servers and determine which application modules they are responsible for supporting. This knowledge is crucial for effectively resolving any performance-related issues that may arise within your applications.
Microservices and mobile offloading
If you use mobile apps to access your business’s services, it is likely that you utilize numerous microservices. These serverless systems could have been developed internally or specifically tailored for your business by a web application consultancy. Alternatively, they may be third-party tools that you subscribe to and customize with your branding. More than likely, they consist of a combination of all these categories.
Development toolkits have become increasingly efficient in accelerating the process of creating Web applications. These toolkits offer pre-existing functionalities, such as element drag-and-drop and picklist management, which significantly streamline the development process. Whenever a user interacts with a feature on your website or mobile app by clicking, tapping, or swiping, these functions are activated. Consequently, it is essential to track, map, and monitor all of these functions.
Distributed tracing and code profiling
Monitoring can become challenging due to the drawbacks of the supporting APIs and plug-ins that simplify web application programming, as well as the content delivery networks and content management systems that ensure efficiency across all your sites.
If the applications don’t generate log messages, your application monitoring tool will not be able to capture them. Since these systems are developed by external individuals and operate on servers outside of your control, there is no way for you to compel internal reporting from application modules.
Thankfully, a large number of Web systems are coded in programming languages that use plain text. As a result, application monitors have the ability to examine the code while it is being transmitted from a Web server to a Web browser. This practice, known as code profiling, is growing in significance and should be considered an essential part of your application monitoring strategy.
Telemetry systems offer a fresh approach to address the challenges of monitoring third-party microservices. Thankfully, providers of serverless systems understand the significance of monitoring in maintaining optimal performance and incorporate messaging features that generate progress reports based on industry standards. OpenTracing, OpenCensus, and OpenTelemetry are three widely adopted universal standards.
Monitoring tools, known as distributed tracing services, capture the messages generated by telemetry systems. By incorporating code profiling and distributed tracing, the issues of monitoring third-party microservices are resolved. Additionally, application dependency mapping highlights the location and impact of these systems on your applications.
Application performance monitoring systems
Now that you have grasped the significance of monitoring your applications, you must determine the approach to achieve it. The most effective method is automation. It is impractical to manually monitor every module as they run due to their simultaneous instances and interactions with multiple other modules. Employing an automated application monitoring tool ensures continuous and reliable performance tracking.
A time-saving tool is one that can generate and maintain an application dependency map at the same time. Additionally, tools that provide hybrid monitoring capabilities will meet all of your needs.
The Best Application Monitoring Systems
AppOptics
Key Features:
- Hybrid systems
- Distributed tracing
- Code profiling
- Server cloud platform
- Virtualizations and containers
APMs often struggle to handle the diverse range of code that arises from building applications using modules written in various languages and developed on different platforms.
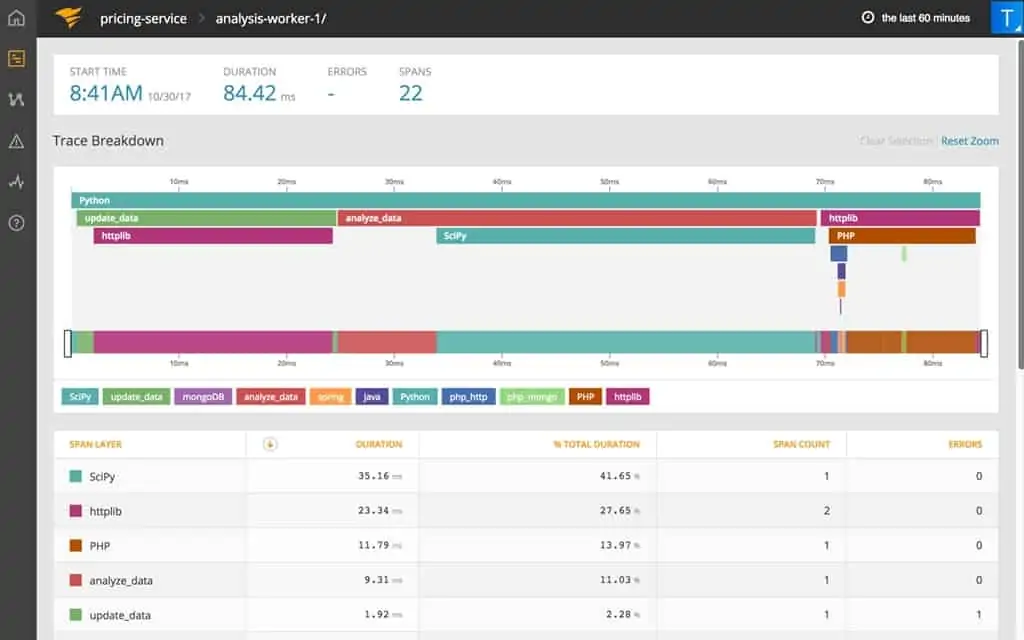
AppOptics is capable of tracing systems built on the Java Virtual Machine (JVM), .NET, and WCF platforms. It also has a comprehension of PHP, Python, Ruby, and Node.js. The monitoring tool automatically identifies the programming language used for each segment of code and adapts its scanning methods accordingly as it analyzes the code.
With this service, you can easily identify your applications and the services they rely on. It will create a map of dependencies and offer ongoing monitoring using various techniques. The console comes with predefined performance thresholds that can be customized and expanded. This feature automates application monitoring, eliminating the need for manual supervision. Instead, you will receive notifications if any issues arise, ensuring proactive management.
Pros:
- A software-as-a-service platform that provides storage for metrics
- Mapping the dependencies of an application along with conducting a root cause analysis.
- Monitoring performance all the way down to the availability of servers and cloud platform resources.
- Tracing the distribution and profiling of code
- Automated, unattended monitoring alerts
Cons:
- Does not incorporate network monitoring
2. ManageEngine Applications Manager
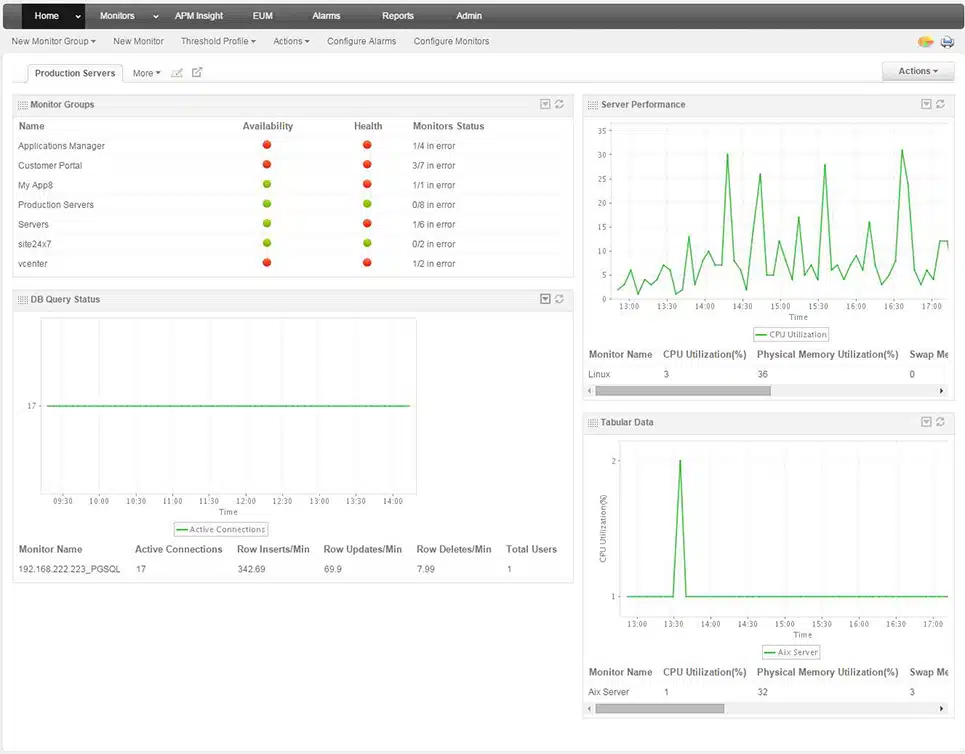
ManageEngine Applications Manager is a comprehensive software solution that can track and monitor all the components that make up a user-facing system. These components may include independent software packages, website elements, or even the web applications developed by your company.
The Applications Manager is capable of monitoring every component of an application regardless of its location, indicating that your software may rely on a function that is performed on a separate server owned by someone else. To collect operational data from each module during execution, the service utilizes distributed tracing. Furthermore, if the system is written in a programming language such as Java, .NET, Ruby, Python, or PHP, the Applications Manager can also inspect the code in real-time and determine the specific line causing an issue when a problem arises.
Key Features:
- Application dependency mapping
- Distributed tracing
- Code profiling
- Root cause analysis
With the tracking capability of Applications Manager, the monitoring tool can accurately identify the specific module that was active behind your user-facing applications when a problem occurred. This enables you to quickly identify and address performance issues, allowing you to determine whether the problem is due to a software coding error or a shortage of physical resources.
The module monitoring system is an advantageous resource for both development teams and operations technicians. It allows managers to evaluate plug-ins and APIs before fully incorporating them into a new application, and acceptance testing can ensure that the new code is free of faults. The package consists of synthetic monitoring tools to validate new code and real user monitoring to oversee performance once a web application is live.
ManageEngine Applications Manager offers three different editions. The initial edition is the Free edition, which has a limitation of monitoring up to five resources. The Professional edition serves as the foundation package for the paid system, while the Enterprise edition provides a higher capacity to cater to the requirements of large corporations. All three editions of the software are compatible with both Windows Server and Linux operating systems. Additionally, users have the option to access the system as a service on AWS or Azure platforms. A 30-day free trial is available for either the Professional or Enterprise edition, and if users decide not to purchase it at the end of the trial period, their software will automatically switch over to the Free edition of Applications Manager.
Pros:
- Beneficial for verifying modules prior to development
- Unit testing can benefit from the use of synthetic monitoring.
- Continuous monitoring of web applications
- Service and server resource monitoring
Cons:
Not a software as a service (SaaS) package.
3. Datadog APM
Datadog APM is provided through a cloud-based platform that consists of various tools for monitoring and managing systems. The team at Datadog is highly engaged and continuously improving their systems. The APM system now primarily relies on distributed tracing and monitoring the performance of web applications. Many aspects of the traditional application performance monitoring that were previously included in the APM are now integrated into the Infrastructure module.
If you require application monitoring for systems like databases or Web servers, you will discover that capability within the Infrastructure Monitoring tool. The ideal approach is to obtain both the Infrastructure and APM system. Incorporate Network Monitoring as well, and you will achieve comprehensive stack observability.
Key Features:
- Autodiscovery
- Dependency mapping
- Service Catalog
- Distributed tracing
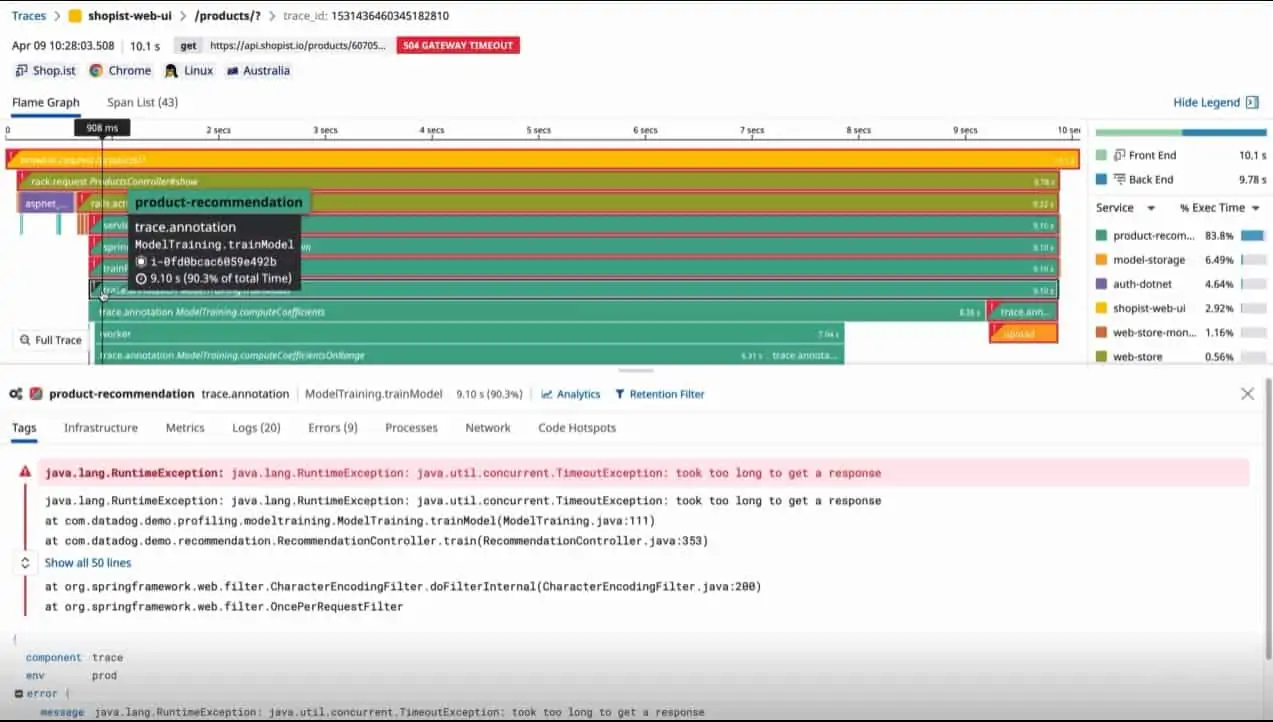
In addition to conducting distributed tracing and application dependency mapping, the Datadog APM offers a deployment tracking capability. This is particularly beneficial for businesses that develop their own applications or integrate third-party systems and require the ability to experiment with various environment configurations before fully implementing the service.
The higher plan includes Code Profiling, which offers the same standard APM features. This feature is capable of scanning code written in Java, .NET, PHP, Node.js, Ruby, Python, Go, or C++ in real-time.
Pros:
- An application dependency mapping system that allows for linking to infrastructure.
- Code profiler, if desired
- Retaining data for the purpose of conducting historical analysis.
- Performance problems can be easily identified through the use of alerts.
Cons:
- A separate module now hosts numerous application monitoring services.
To begin using the Datadog system, simply register on the service’s website and access its console using any regular web browser. Take advantage of the 14-day complimentary trial period to explore all features and determine which modules suit your needs before committing to a subscription.
4. Dynatrace Full-stack Monitoring
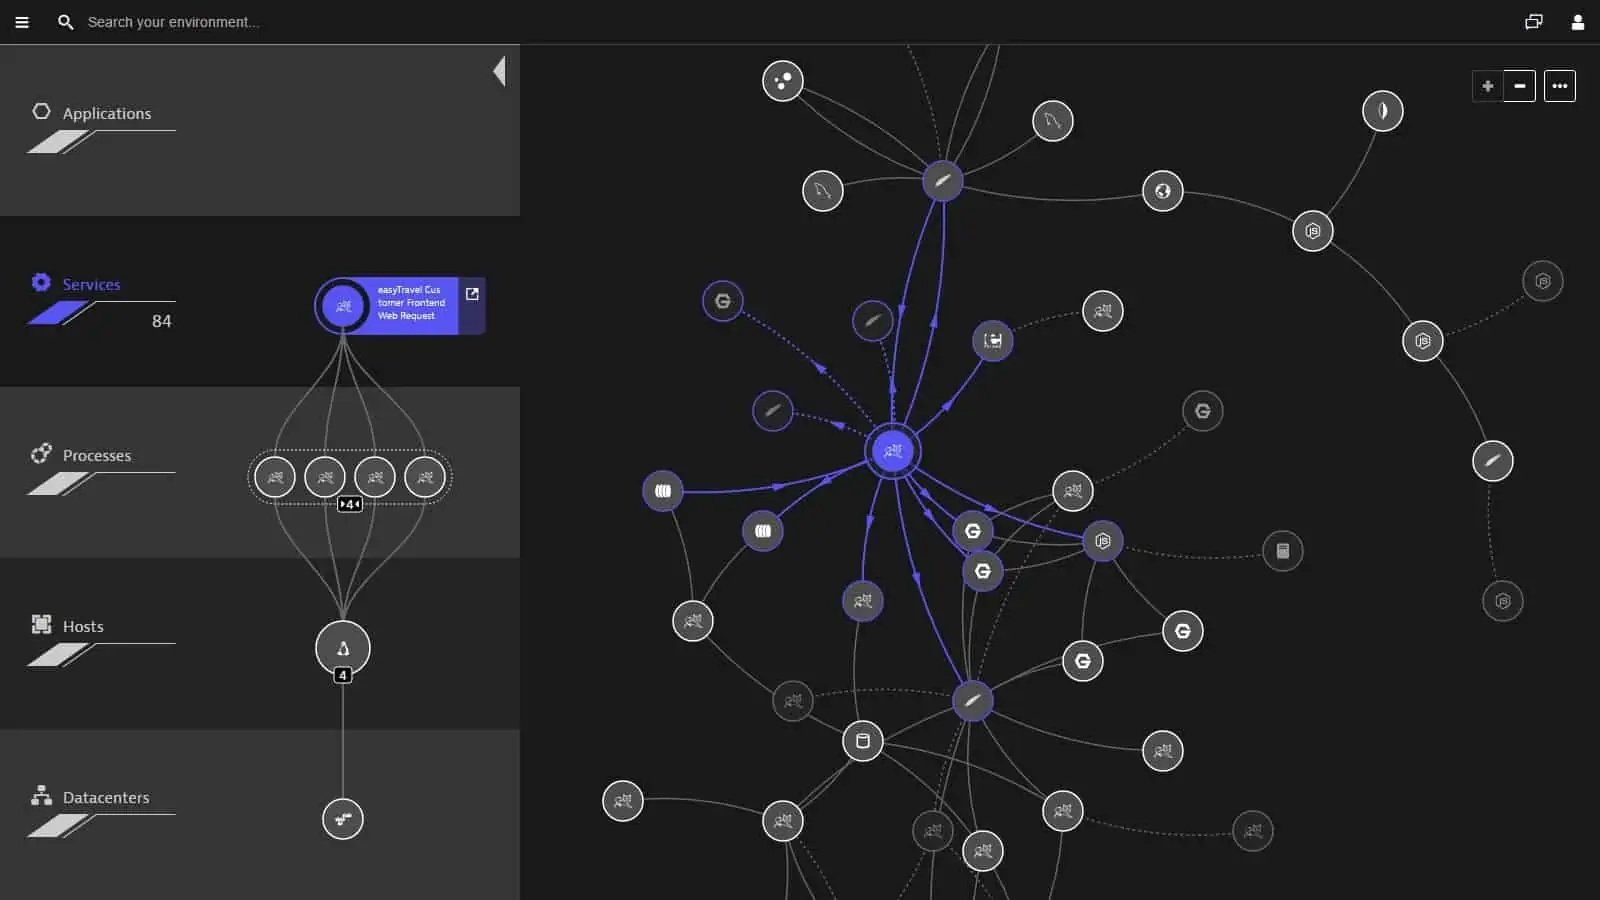
Dynatrace is a Software as a Service (SaaS) platform that offers various modules. By subscribing to the Full-stack Monitoring package, users gain access to infrastructure monitoring and Application Performance Monitoring (APM). Additionally, the package includes AlOps features, which have the capability to forecast resource shortages and potential access conflicts.
Key Features:
- Dependency mapping down to the server
- Distributed tracing and code profiling
- AI-based root cause analysis
In addition to security monitoring and digital experience monitoring, the Dynatrace platform also provides the capability to store all gathered metrics for manual historical analysis. As a Software as a Service (SaaS) package, Dynatrace Full-stack monitoring collects and stores system logs for further examination. The distributed tracing and code profiling services in the bundle also generate log files that contribute to the pool of analytical data.
Pros:
- Appropriate for both development and operations assistance
- Utilizes a variety of observability approaches
- Offers proactive notifications for potential resource problems
Cons:
- Additional charges are applicable for complete log management.
5. New Relic
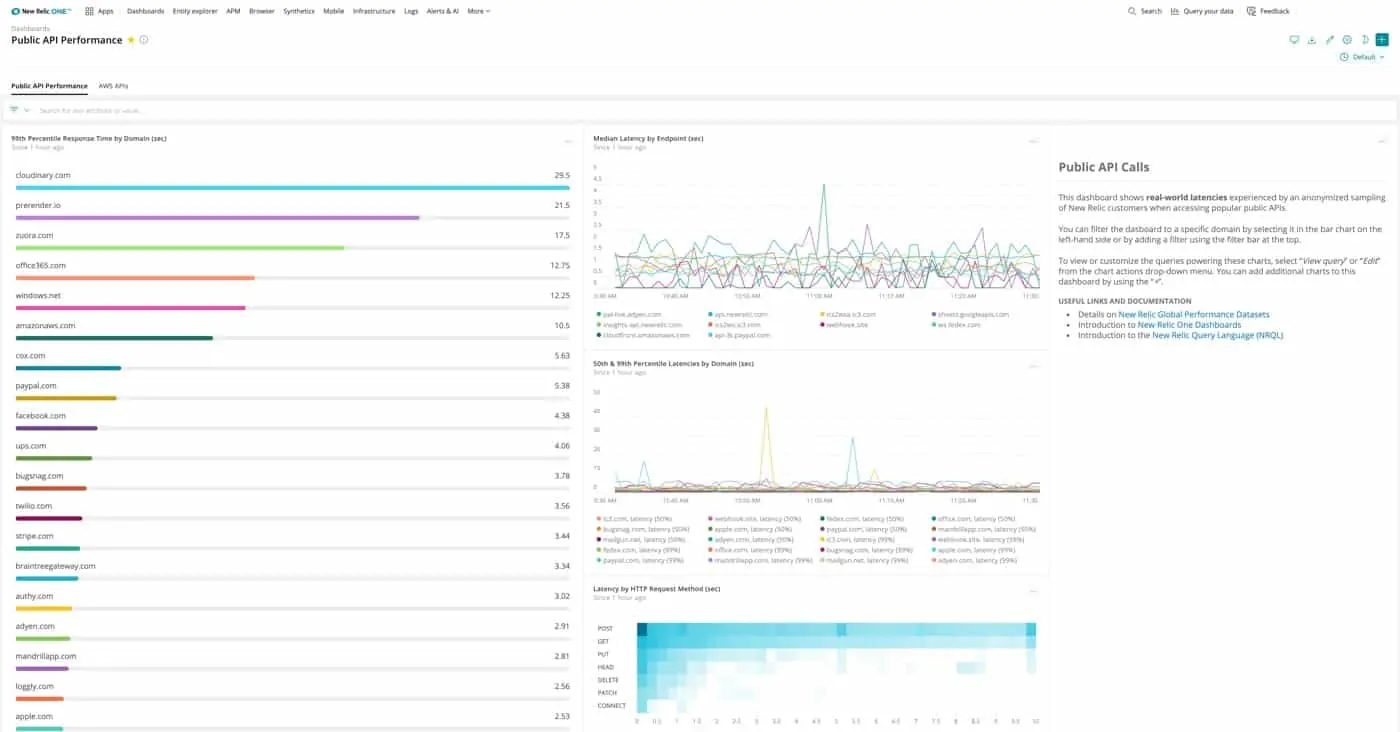
New Relic offers a comprehensive range of observability features in its SaaS package, providing users with a complete view of their applications. This includes application discovery, dependency mapping, distributed tracing, real-time code profiling, and infrastructure monitoring. Additionally, the service includes network monitoring, container and virtualization tracking, and employs machine learning for its alerting system.
Key Features:
- Application dependency mapping
- Full-stack observability down to the network
- A complete system monitoring package
The pricing for the New Relic service is based on the number of users rather than servers, ensuring that all businesses, regardless of size, have access to its complete range of services. In addition to a bug tracker, the service also provides synthetic web application testing specifically designed for operations teams. It is worth noting that you can create one user account for free indefinitely, which can be beneficial for evaluation purposes.
Pros:
- Scanning of applications powered by artificial intelligence
- Anticipatory notifications
- Retention of data for the purpose of analysis
Cons:
- Extensive training is required to fully utilize all of the functions.
More From Cliolink
- How To Watch India vs South Africa Live Streaming
- How To Watch Bangladesh VS Sri Lanka Live Streaming
- How To Watch England Vs Australia Live Streaming
Bottom Line
Monitoring your application is a crucial aspect of ensuring its optimal performance and user experience. By monitoring your application, you can proactively identify and address any issues or bottlenecks that may arise, minimizing downtime and maximizing uptime. Additionally, monitoring allows you to track important metrics such as response time, server load, and user activity, providing valuable insights into the performance and usage patterns of your application. This information can help you make informed decisions about scalability, resource allocation, and optimization efforts. Ultimately, by prioritizing application monitoring, you can enhance the reliability, efficiency, and overall success of your application.